
TrainingPeaks Performance Management Chart (PMC)
The PMC helps track your training progression by monitoring three key metrics:
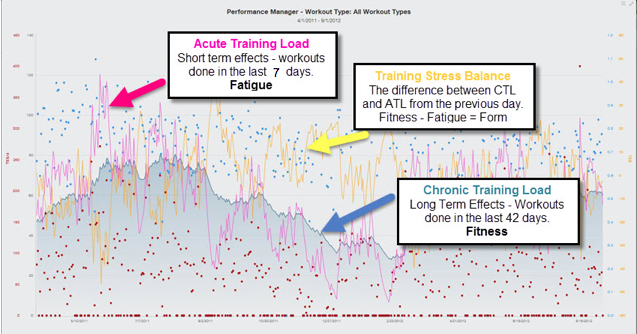
Chronic Training Load (CTL) – “Fitness”
Long-term training load (6-week average TSS).
Higher CTL = greater endurance/workload capacity.
Acute Training Load (ATL) – “Fatigue”
Short-term training load (7-day average TSS).
High ATL = recent intense training, signaling a need for recovery.
Training Stress Balance (TSB) – “Form”
TSB = CTL − ATL
Positive TSB → fresh and race-ready
Negative TSB → fatigue accumulation, important for adaptation
What is TSS?
Training Stress Score (TSS) measures workout load based on intensity and duration:
Cycling: 100 TSS = 1 hour at threshold power/HR
Running: 111 TSS = 1 hour at threshold pace/HR
Note: A short, intense session can equal a long, easy one in TSS but affects your body differently.
PMC Updates After Each Workout:
Fitness (CTL): 6-week average TSS
Fatigue (ATL): 7-day average TSS
Form (TSB): CTL minus ATL
Does Higher CTL Mean Better Fitness?
Not always. CTL shows accumulated training load but doesn’t guarantee peak performance:
Too much low-intensity training → high CTL but limited speed/power
Too many hard sessions without recovery → fatigue limits gains
Recovery Matters:
Structured plans with hard weeks followed by recovery weeks improve performance more than simply chasing CTL.
Phil’s plans gradually ramp intensity with 2–3 hard weeks + 1 recovery week.
Tracking Progress Effectively
Performance > numbers: Regular fitness tests track improvement more reliably than TSS alone.
Improved thresholds: Even if TSS is the same, higher thresholds = better performance.
Consistency: Conduct tests under similar conditions for accurate comparisons.
Important Notes
PMC can be misleading if your training thresholds aren’t accurate.
CTL is personal—don’t compare yours to others. A lower CTL doesn’t mean lower fitness.
4 Tips to Maximize Your Metrics
Track threshold improvements – Use regular fitness tests.
Avoid CTL comparisons – Focus on your own progress.
Update thresholds – Adjust TrainingPeaks settings after each test.
Review automatic updates – Check before accepting suggested threshold changes.
Copyright MyProCoach® Ltd © July 2020. All rights reserved.
Comments
0 comments
Please sign in to leave a comment.